|
Sheffield Solar Catalogue (SSC) N. Gyenge, H. Yu (余海东 ), V. Vu, M. K. Griffiths and R. Erdélyi
|


|
Regular sunspot observations (darker regions on the solar surface) were established as early as the 16th century. Since then, the revolution of IT techniques and tools has reshaped the daily routine of the solar observatories whose main task was and still is to build up various long-term catalogues of a wide range of solar features. The mostly manual workload became gradually being replaced by automated solutions, such as the development of robotic telescopes, automated feature recognition algorithms, etc. Nevertheless, some manual elements still remained a part of the normal daily routine of many astrophysical institutes. The Sheffield Solar Catalogue (SSC) project is a free and open-source software package for the analysis of solar data intents to establish a fully automated solar feature recognition environment from the raw images of solar observations to a user-friendly and science-ready data source. The underlying core program is able to provide a real-time comprehensive solar features data analysis environment, aimed to assist researchers within the field of solar physics and astronomy. At this stage of development, SSC is suitable for generating sunspot data fully automatically, based on white light continuum and magnetogram observations by the Solar Dynamics Observatory (SDO) satellite (Pesnell, W. D. (2015). Solar dynamics observatory (SDO) (pp. 179-196). Springer International Publishing.). Although, the project is currently focused on sunspot groups and sunspot identification, the database will be extended later to other solar features, such as solar pores, faculae, coronal holes, jets, spicules and other solar phenomena. Figure 1 demonstrates the flowchart of the project, where the rectangles indicate the most important parts of the source code. The source code can be separated into three different layers, as is shown in the lower yellow rectangle. or data production from the raw solar images to the scientific data (i.e., data tables) the backend (or engine) is responsible . This program layer is fully written in Python 3 programming language. 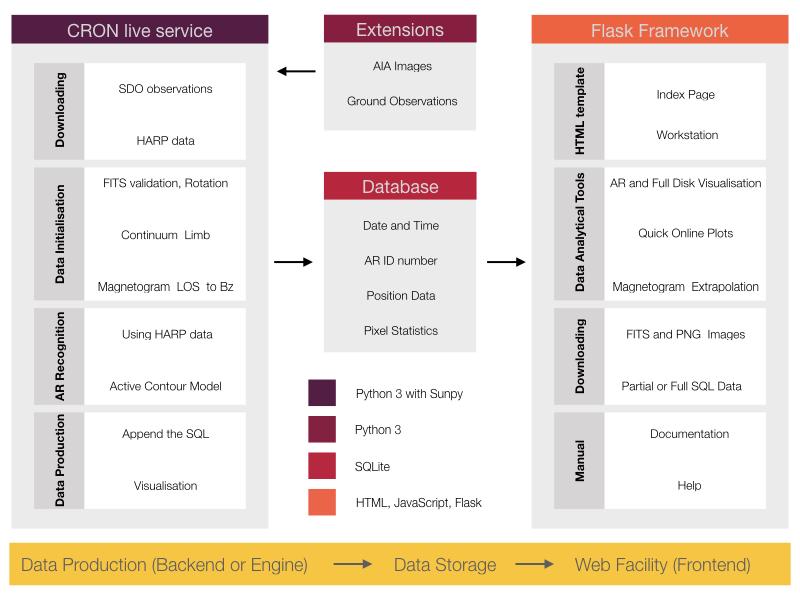 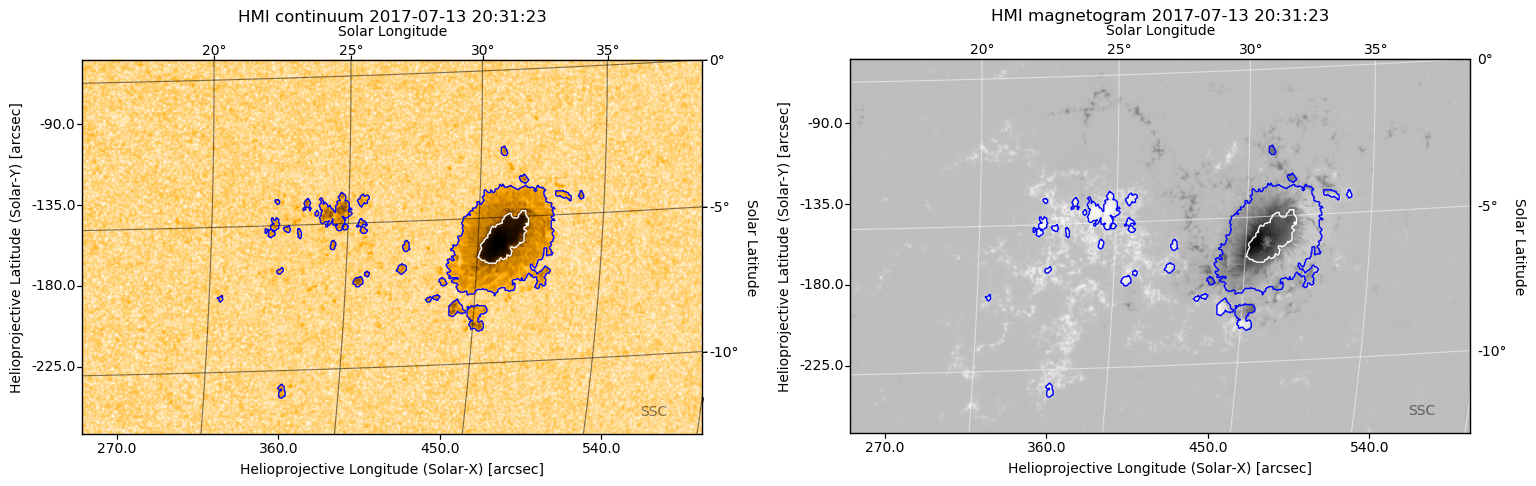 At the first step, the raw observations are downloaded from the JSOC server which provides the SDO observations. Nonetheless, the data need to be amended before an actual scrutiny. The images must be validated and de-rotated, if necessary. In case of continuum images, limb darkening is corrected, which is an optical effect seen in the solar images, where the centre of the images appears significantly brighter than the edges. Similarly, the magnetogram is corrected as well. After the necessary corrections, the algorithm begins identify the physical boundaries of the sunspots. However, additional information is also required for identifying each sunspot within every active region (AR). Now, the data matrices (i.e. sub-images about the sunspots from the full observation) are selected for each AR by using the HARP data (again, see the JSOC server). The HARP data provide an approximate boundary for each AR, which is an appropriate initial condition for further analysis. The actual physical contour of umbra and penumbra (almost every sunspot can be decomposed into this two regions where the difference between them is the photon intensity) is now generated by the active contour model algorithm. The output is written in individual PDF and PNG files as Figure 2 demonstrates. Finally, the scientifically valuable data are written into an SQL table, where the engine terminates. The appended SQL table is available for further services, however, every few minutes, the engine loops back to the first step with a new observation and so on. The next layer of processing is the data storage, which contains the output of the engine. Here, the raw scientific data are transformed and stored in a currently popular SQL format. Table 1 demonstrates a few lines of the database. Each line represents one sunspot in each sunspot group. The line contains the most important pieces of information about the spot such as the date, the time of the observation, the coordinates in Carrington Heliographics, Polar and Helioprojected reference systems (Thompson, W. T. (2006). Coordinate systems for solar image data. Astronomy & Astrophysics, 449(2), 791-803.) and the area of every sunspot. The columns on the right-hand side show some basic statistics (maximum, minimum pixels, standard deviation and also the average of the sample) of the pixels composing the sunspots.  The server also stores images about the processed sunspot groups and contours in FITS and PNG format as demonstrated by Figure 2. The output for one set of observation takes around 50 Mb space on the hard drive. It means that with a 5-minute cadence (the currently chosen default cadence of the project), the program generates about 15 Gb data each day resulting in more than 5 Tb data per annum. Ultimately, a one-minute cadence (the desired temporal resolution) is going to write out 75 Gb daily and 25 Tb data annually, respectively, however this cadence requires massive parallelisation in the source code. Finally, the last layer is the web facility, what is the user-friendly online frontend of the project. The frontend is based on a hybrid software solution, where the HTTPS server is supported by the Python Flask framework (templating HTML pages with CSS) and JavaScript. The web service is able to display, visualise and analyse the data received from the engine backend. The user can select, filter and sort the data. The selected data can be downloaded (via the HTML page or sFTP protocol) or analysed by the built-in plotting tool, powered by the Bokeh engine, which is able to provide elegant and interactive plots (a screenshot is shown in Figure 3). 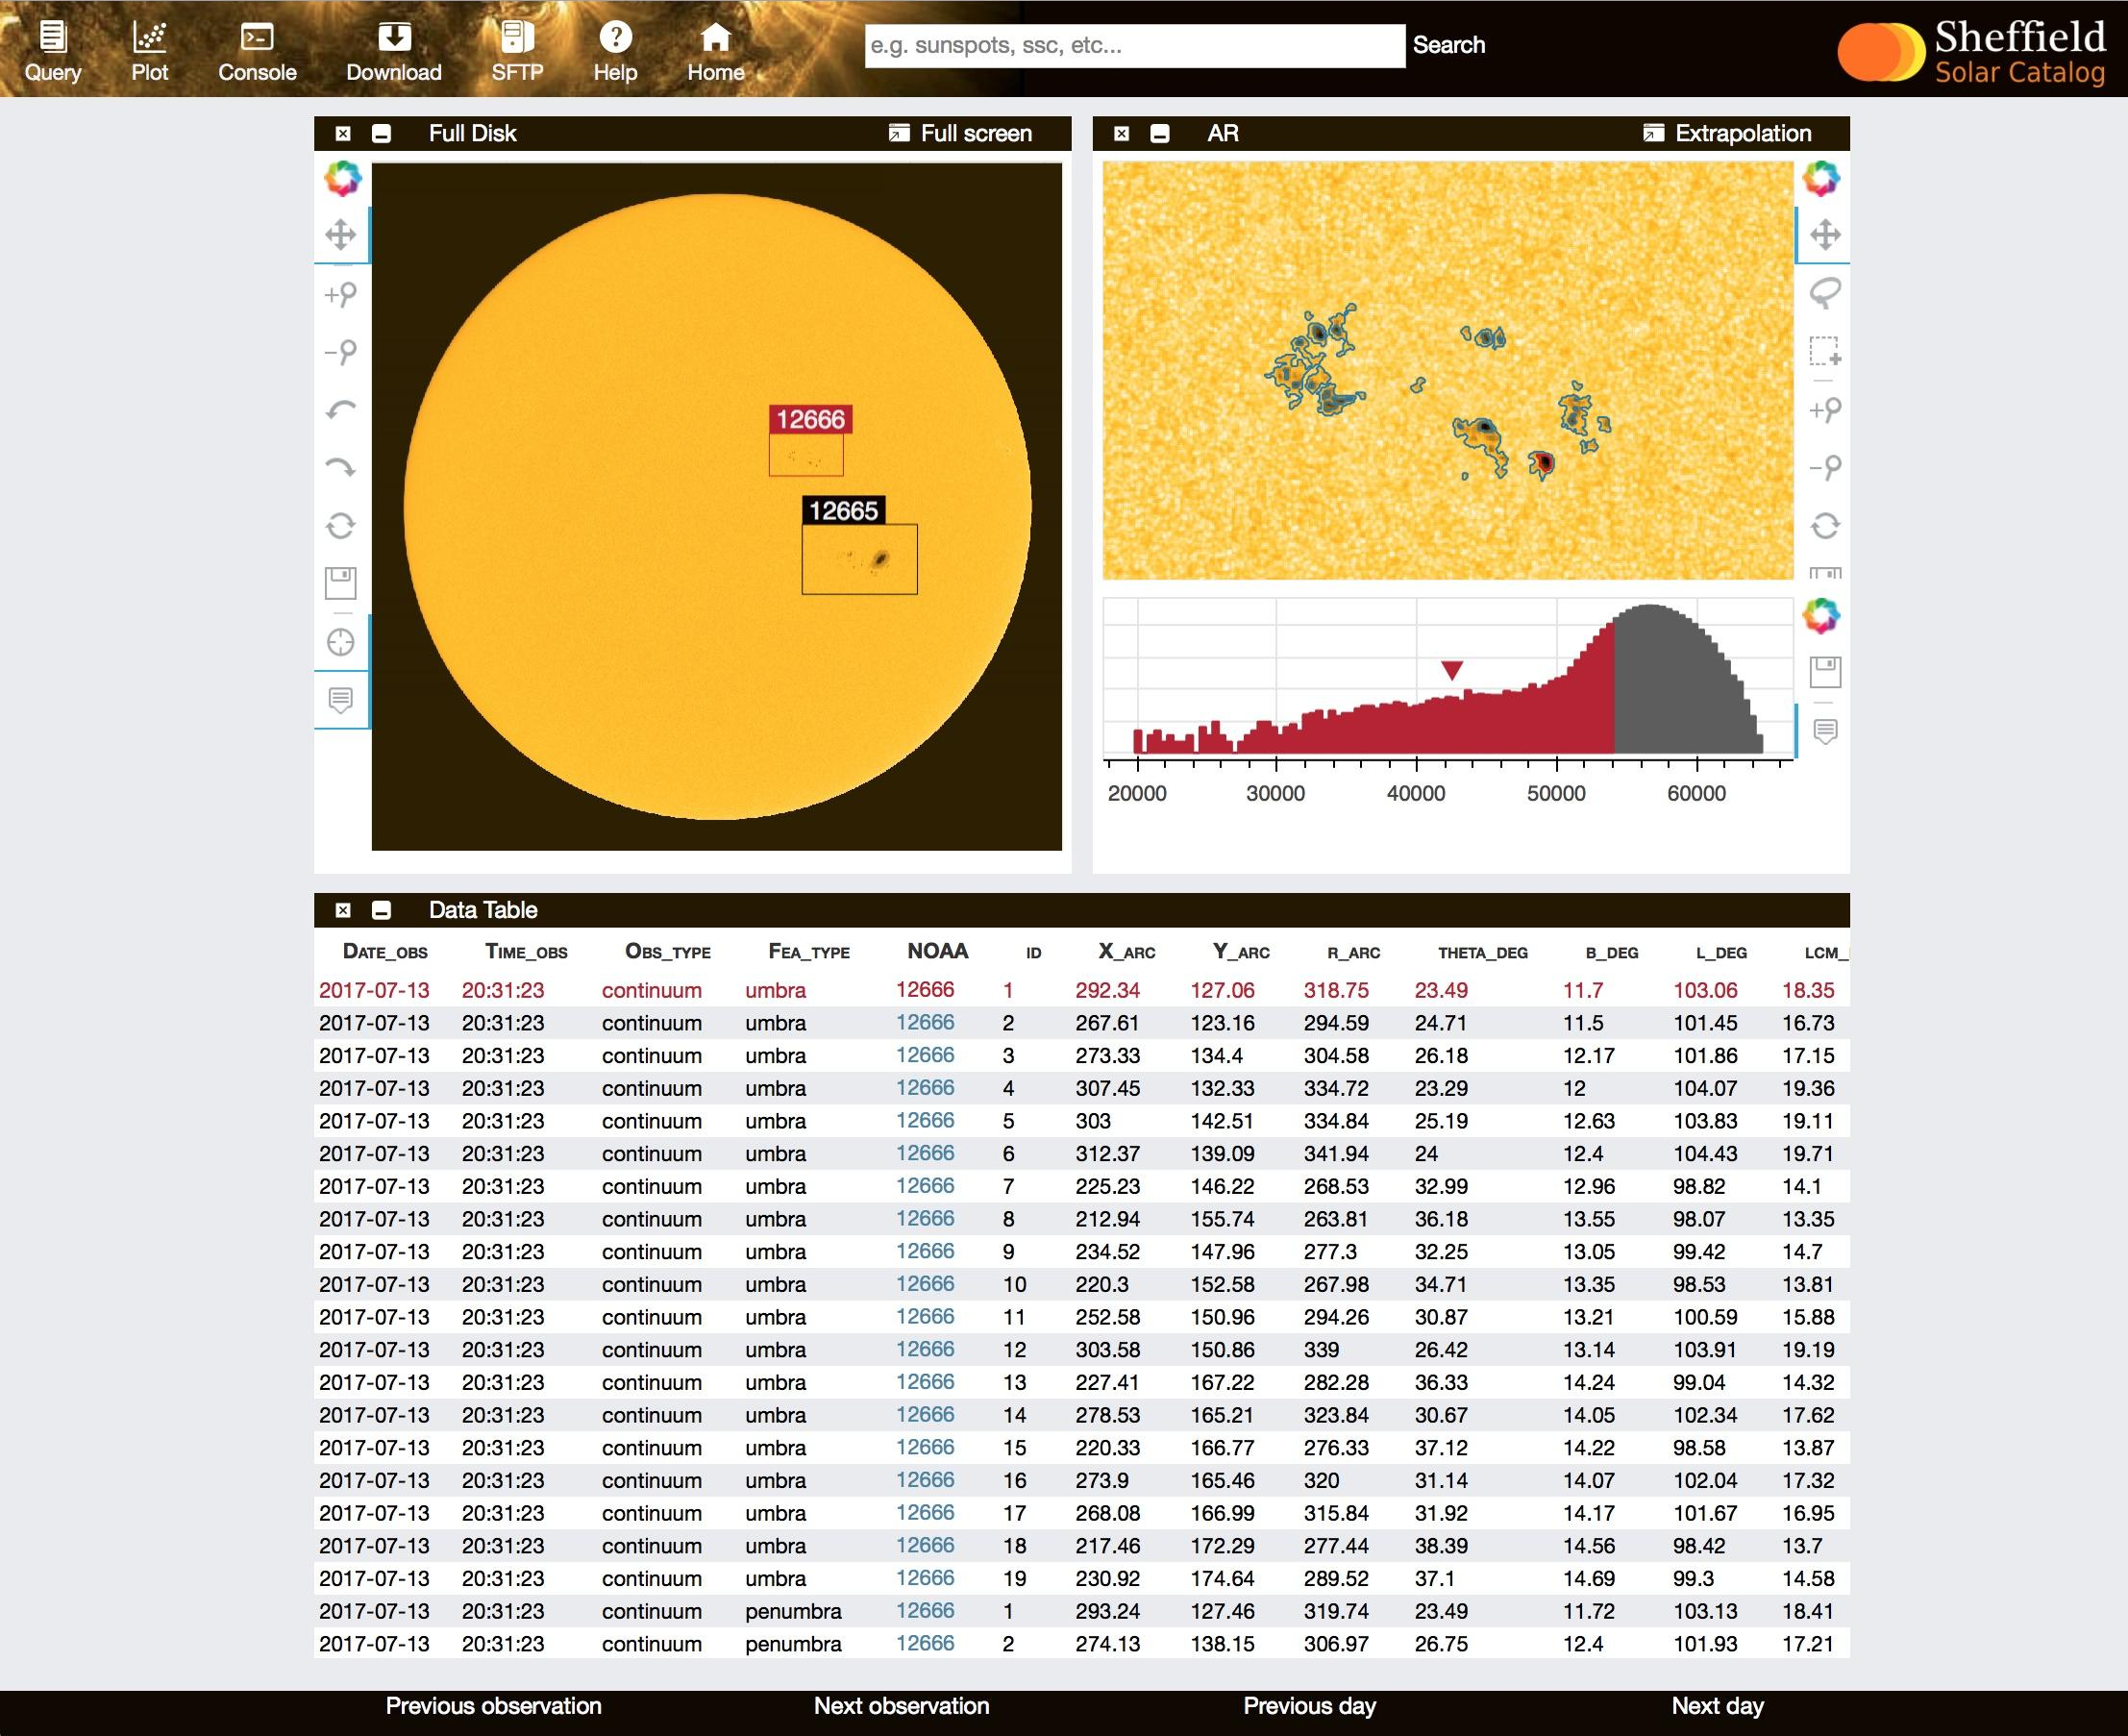 The project is going to be extended in the future with additional tools and types of observations. A jet recognition algorithm is now under development, based on SDO AIA images. Furthermore, parallelization techniques will be implemented in the source code in the near future, possibly, by using GPU and/or MPI architectures. The project is open-source, therefore, the developing team is constantly looking for researchers who would like to be involved.
|
|
Magyar Napfizikai Alapítvány Hungarian Solar Physics Fundation |
Last update: 2023 Mar © Copyright HSPF 2017 |